Climate and Weather Charts
Tenerife South Airport (TFS)
(Tenerife, Canary Islands, Spain)

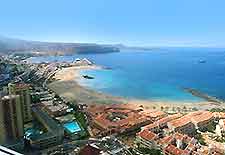
The island of Tenerife features a subtropical climate with year-round sun and warm weather. Famed for its endless days of sunshine and attractive beaches, Tenerife is surrounded by the Atlantic Ocean. With cool and refreshing sea breezes, known as the Passat Winds, and a relatively low humidity, Tenerife has long been a top tourist destination. The island is particularly popular during the warm winter months of December, January and February, when daytime temperatures rarely drop below 22°C / 72°F, although night-times can feel a little chilly at this time of the year.
Summer highs of 30°C / 86°F or more can be expected during July and August, when Tenerife's climate is at it hottest, resulting in warm waters, which are ideal for swimming and a range of water sports. The rainfall throughout Tenerife tends to increase during the autumn and winter, with the summer months being noticeably drier. However, even the heaviest the showers are usually quick to clear. The average annual daytime temperatures on Tenerife are around 25°C / 77°F.
Climate Description: Subtropical climate
Tenerife South - Reina Sofia Airport (TFS) Location: Northern Hemisphere, Spain
Annual High / Low Daytime Temperatures at Tenerife: 30°C / 21°C (86°F / 70°F)
Average Daily January Temperature: 21°C / 70°F
Average Daily June Temperature: 27°C / 81°F
Annual Rainfall / Precipication Tenerife at Airport (TFS): 607 mm / 24 inches
Tenerife South - Reina Sofia Airport (TFS):
Climate and Weather Charts
Temperature Chart |
| Temperatures |
Jan |
Feb |
Mar |
Apr |
May |
Jun |
Jul |
Aug |
Sep |
Oct |
Nov |
Dec |
Average |
Maximum
Celcius (°C) |
21 |
21 |
22 |
23 |
24 |
27 |
29 |
30 |
28 |
26 |
24 |
22 |
25 |
Minimum
Celcius (°C) |
15 |
15 |
16 |
16 |
17 |
19 |
21 |
22 |
21 |
20 |
18 |
16 |
18 |
Maximum
Fahrenheit (°F) |
70 |
70 |
72 |
73 |
75 |
81 |
84 |
86 |
82 |
79 |
75 |
72 |
77 |
Minimum
Fahrenheit (°F) |
59 |
59 |
61 |
61 |
63 |
66 |
70 |
72 |
70 |
68 |
64 |
61 |
65 |
Rainfall / Precipitation Chart |
| Rainfall |
Jan |
Feb |
Mar |
Apr |
May |
Jun |
Jul |
Aug |
Sep |
Oct |
Nov |
Dec |
Total |
| Rainfall (mm) |
89 |
76 |
64 |
43 |
23 |
10 |
5 |
5 |
15 |
61 |
114 |
102 |
607 |
| Rainfall (inches) |
3.5 |
3.0 |
2.5 |
1.7 |
0.9 |
0.4 |
0.2 |
0.2 |
0.6 |
2.4 |
4.5 |
4.0 |
24 |
Seasonal Chart |
| Seasons |
Average
Temp
(Max °C) |
Average
Temp
(Min °C) |
Average
Temp
(Max °F) |
Average
Temp
(Min °F) |
Total
Rainfall
(mm) |
Total
Rainfall
(inches) |
| Mar to May (Spring) |
23 |
16 |
73 |
62 |
130 |
5 |
| Jun to Aug (Summer) |
29 |
21 |
84 |
69 |
20 |
1 |
| Sept to Nov (Autumn / Fall) |
26 |
20 |
79 |
67 |
190 |
8 |
| Dec to Feb (Winter) |
21 |
15 |
71 |
60 |
267 |
11 |
 The island of Tenerife features a subtropical climate with year-round sun and warm weather. Famed for its endless days of sunshine and attractive beaches, Tenerife is surrounded by the Atlantic Ocean. With cool and refreshing sea breezes, known as the Passat Winds, and a relatively low humidity, Tenerife has long been a top tourist destination. The island is particularly popular during the warm winter months of December, January and February, when daytime temperatures rarely drop below 22°C / 72°F, although night-times can feel a little chilly at this time of the year.